
Five Strategies for Analyzing Data with ChatGPT
Initial investigations on how to perform data analysis with AI tools

Over the last few days, I have been “playing” with ChatGPT to keep developing a feel for what it can and cannot do with data. You may recall that I have conducted some initial experiments in the past, as well.


This time, I tasked myself with analyzing the Boston Vision Zero Crash data set. This dataset collects information about vehicle crashes occurring in the Boston area. The dataset is quite simple. It contains information about when and where the crash occurred, whether it involved a motor vehicle, bicycle, or pedestrian, and the type of location (intersection, street, or other).
My goal is not to show you everything I did, but rather to share a few strategies I have developed while analyzing data with ChatGPT.
Strategies
Looking back at the many prompts I wrote for the analysis, I have identified four important strategies.
1. Be specific
There are a million ways one can ask ChatGPT to do something for them. I always obtain the best results when I am specific and thorough. For example, I don’t ask ChatGPT to “show me the trends over time” (a vague and underspecified request), but rather, I ask, “Generate a line chart showing weekly count of crashes.” Most of the time, I try to include information about (a) what type of chart I want, (b) what type of data transformation is needed, and (c) how I want the variables to be mapped. This is a good example: “Create a line chart showing the number of crashes by the hour of the day.” Here, I specify the plot I want to use (“line chart”), the metrics it needs to compute (“number of crashes”), and the granularity I want to use (“by hour of the day”).
2. Use coding tools (notebooks)
It would be fantastic if everything could be done within ChatGPT, but the reality is that some tasks require coding. The good news is that one does not need to be particularly proficient in coding, as ChatGPT and all other LLMs excel at producing code. One just needs to learn how to launch a notebook, such as Jupyter or Google Colab, and trust that they will be able to copy and paste code to try things out. When using code while not being proficient, three things work really well: (a) ask ChatGPT to produce code for one step at a time, (b) ask ChatGPT to explain what different parts of the code do, and (c) ask ChatGPT how to perform certain operations through code. I found that even if I don’t know how to do something, the notebook quickly becomes a learning-by-doing environment where ChatGPT tells me how to do something, and I try it out in the notebook (which is also a great strategy to deal with cognitive debt).
3. Ask for interpretations
LLMs bring a completely new element to the data analyst toolkit: a machine that can provide interpretations of the generated output. When a new chart is generated, you can ask ChatGPT to explain what the graph shows and why a certain relationship exists. Now, the results can be wildly inaccurate, but this is not the point. By providing you with some kind of reasoning, it can help you think about potential causes for effects that you observe. Here is a good example of this idea. I created a box plot showing the relationship between precipitation and the number of crashes. If you are not careful, you may expect that the number of crashes increases with the precipitation amount, but this is what the chart looks like:
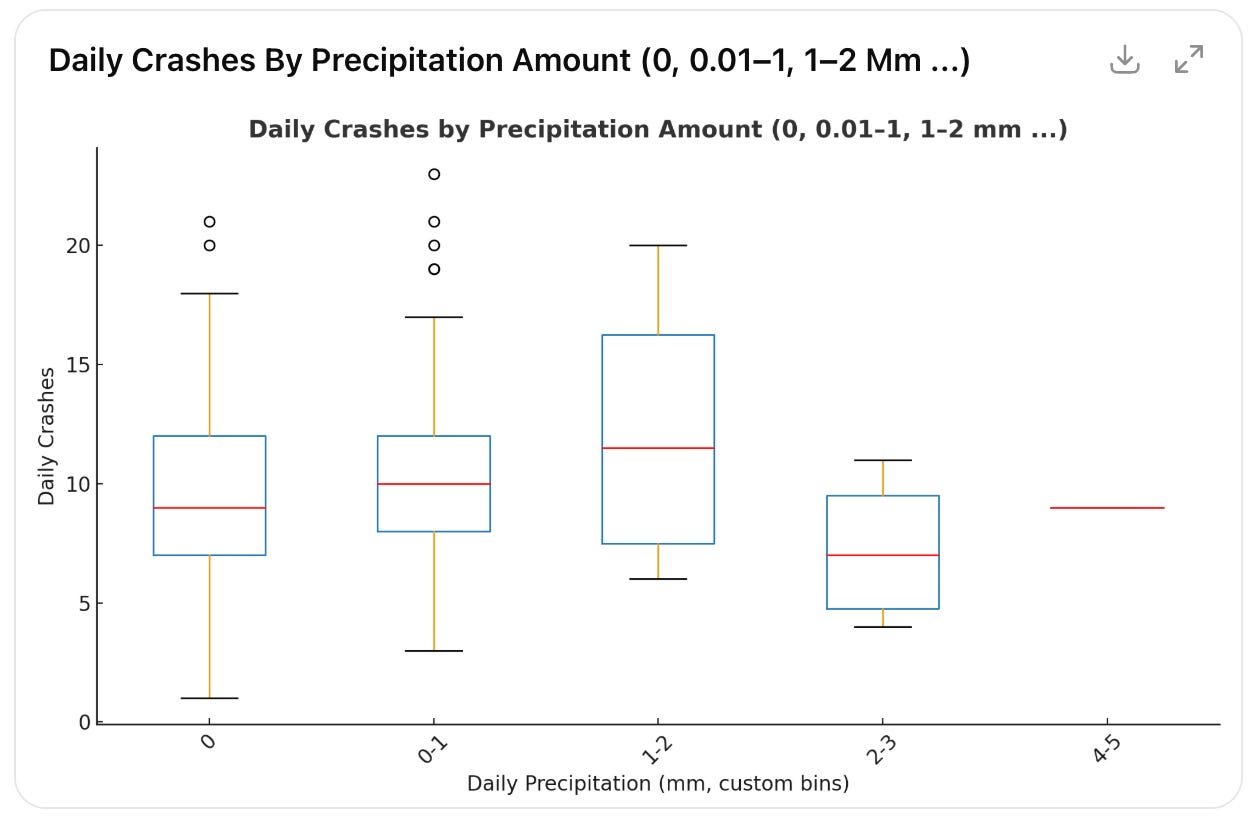
How do you explain that? Well … you can ask ChatGPT and see if it has a sensible explanation. Here is what it returned:
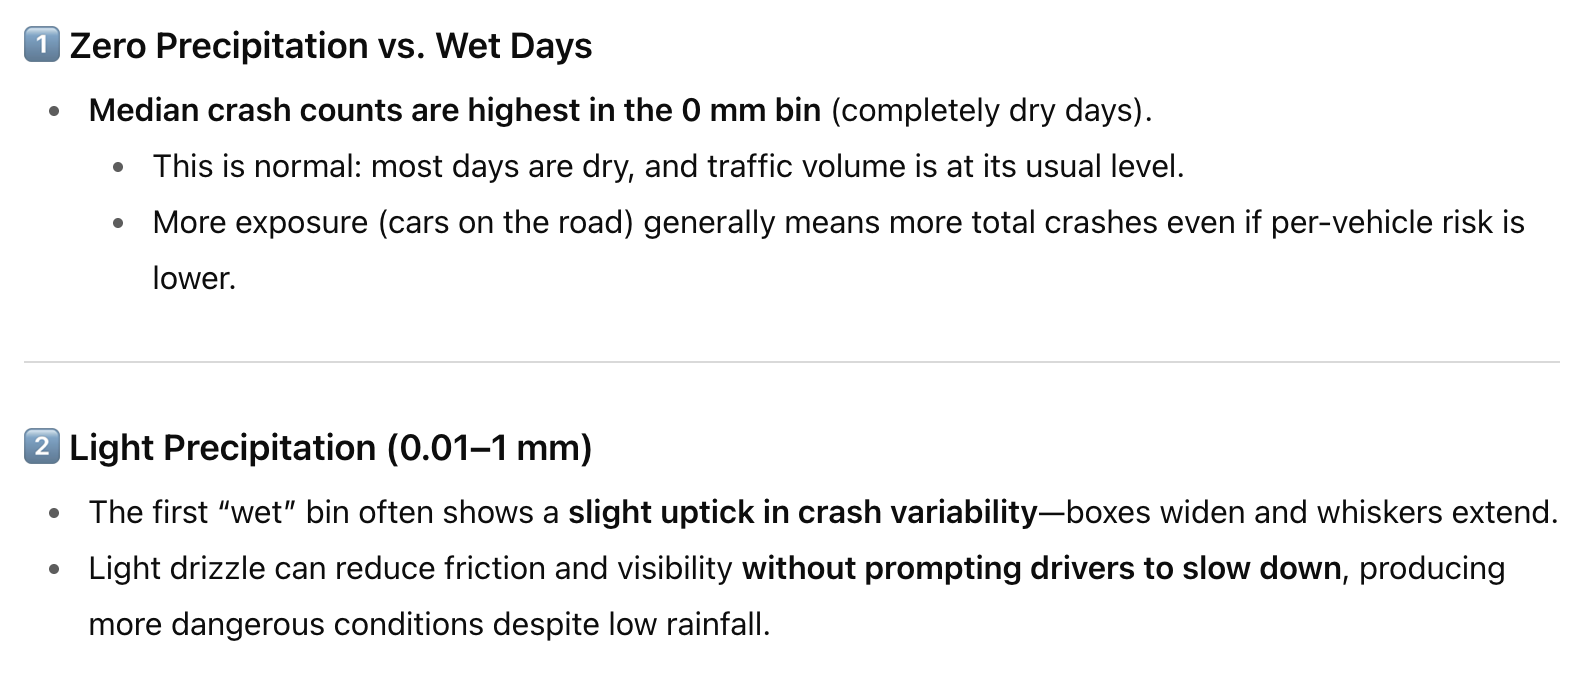
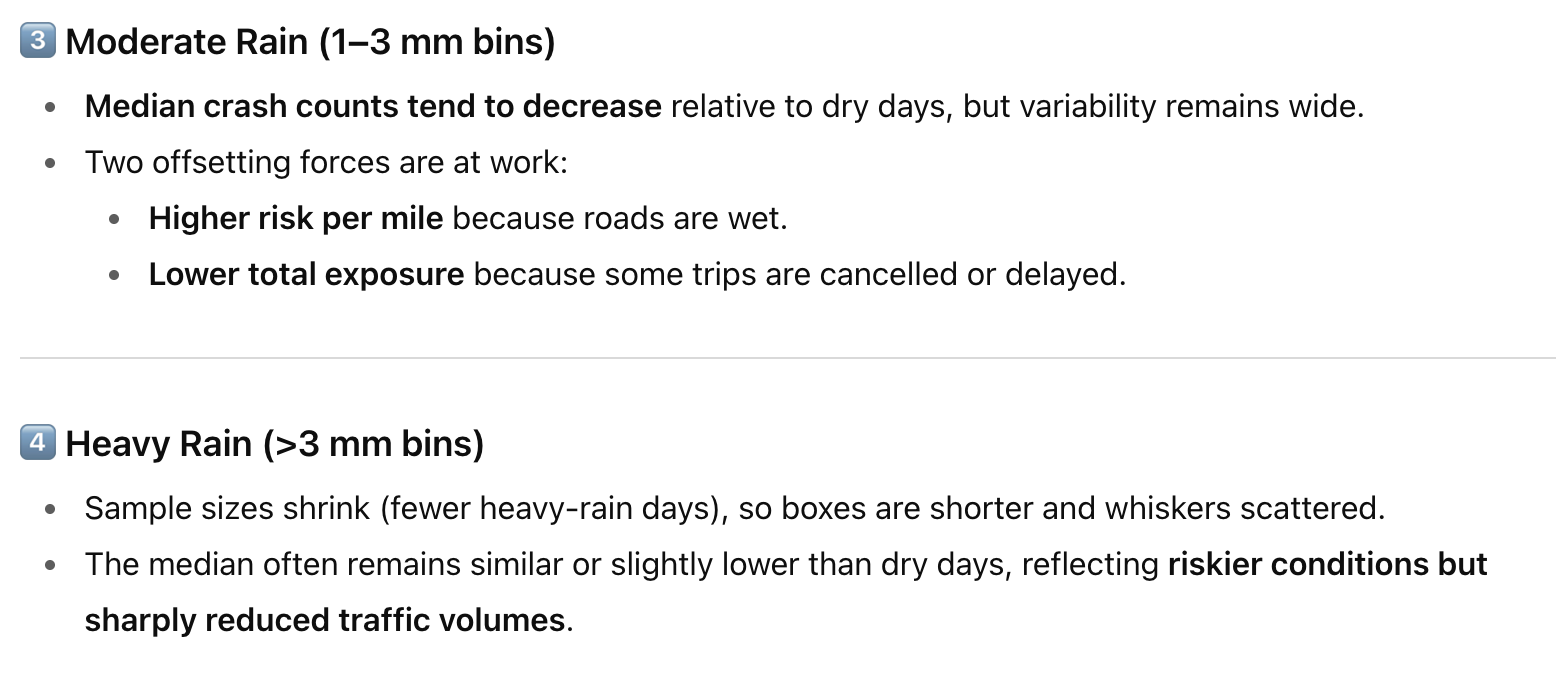
It’s pretty impressive if you think about it. It provides a good account of the fact that even if more precipitation produces riskier conditions, the number of cars decreases, thus reducing the chances of collisions. (As a side note, this is a fantastic example of “ base rate bias,” a common interpretation problem I cover in my course on how to “Think Effectively with Data Visualization.”)
4. Ask for guidance
At some point during my analysis, I wanted to produce a heat map showing how collisions are distributed spatially. I knew that I had to ask it to produce a distribution using Kernel Density Estimation (KDE) (a statistical method to generate a continuous distribution from discrete data points), but I could not recall what parameters I had to set to produce the image I wanted. The first result did not have enough details (the one on the right), and I knew the problem was in the KDE settings.


As a next step, I asked it to explain to me how KDE works and what parameter I had to change to obtain the results I wanted, and this is exactly what it did. The image on the right is what I obtained after learning how to use KDE properly (FYI: the parameter to set was the “bandwidth”).
5. Ask, “What else?”
In one of my previous posts, I already demonstrated that ChatGPT can help you figure out what questions you can ask a dataset.
But a more interesting use of this idea is when you have already explored a few trends and you feel like you are hitting a wall. In this case, you can ask, “What else should I explore?” I tried this a few times and it works surprisingly well. Again, do not expect ChatGPT to be perfect and do the work for you. What ChatGPT does very well is to give you new paths, new ideas, so that you can continue with your own creativity.
Conclusion
There is a lot more I’d like to share, even from this simple interaction. Here, I focused only on a few useful strategies but I have more to share. In a future post, I’d like to highlight what does not work well and ideas on how LLM-based interfaces for data analysis could be improved. Stay tuned!
If you have any experience performing data analysis with ChatGPT, let me know how things work for you. Leave a commnt below. I’d love to hear your story.
Thanks!
Muchas gracias Enrico por el aporte. En lo que vengo experimentando entre datos y ChatGpt coincido plenamente con tus conclusiones. En mi experiencia, el escribir más líneas detallando algo de contexto y el objetivo deseado y con los datos que tengo, logro muy buenos resultados, siempre más de lo estrictamente esperado. Como bien tú lo dices, abriendo otras líneas nuevas que uno puede evaluar explotarlas o ignorarlas.