Can AI Suggest Good Data Questions?
Yes.
In one of my past posts, I tried to answer the question, “What Can I Do for Data Visualization?”
In that post, I argued that AI can support many steps of the data processing and presentation process. I imagined what the role of AI could be at different stages of the data processing pipeline, considering data gathering, data transformation, visual representation, and presentation. For each of these steps, I provided ideas of what AI could do to improve, ease, or speed up what analysts and designers normally do manually (or semi-automatically) at each step. What I had not considered back then was whether AI can help with steps that come before or after these steps. It seemed natural to me that (1) we would want support for steps that are already associated with some form of computation and (2) any steps before data gathering or after data presentation are just inherently human. However, over time, I started questioning my initial assumption and considering ways in which AI could help with areas that we consider inherently human. In fact, I have been considering writing a twin post to my original AI post titled “What Can AI NOT Do for the Data Visualization?” and finding it hard to give a definite answer. I still want to write that post, but in the meantime, I want to show one surprising way in which AI (or, more appropriately, large language models) can help with tasks that were almost impossible to conceive before the advent of LLMs.
In this little experiment, I asked ChatGPT to tell me what questions I should ask a data set to see if it would come up with anything sensible. For this experiment, I used one of the data sets I am more familiar with, the NYC vehicle collision data set, which collects information about every recorded collision happening in New York City. I am very familiar with this data set because I have used it for many years to create examples for my courses (you may recognize it from many of my posts, especially the ones in the data transformation series) and to assign exercises to my students. This data set is particularly valuable for this experiment because I often use it in my “data questions” exercise, where I ask students ideate questions to ask with this data set. I have written several times here about how I use the concept of “data questions” for teaching. Below, you find a recent post where I talk about this model.
This is to say that I am not only familiar with this data set but also very familiar with what kind of questions can be asked about it and, more importantly, what kind of questions students formulate when asked to produce data questions about it.
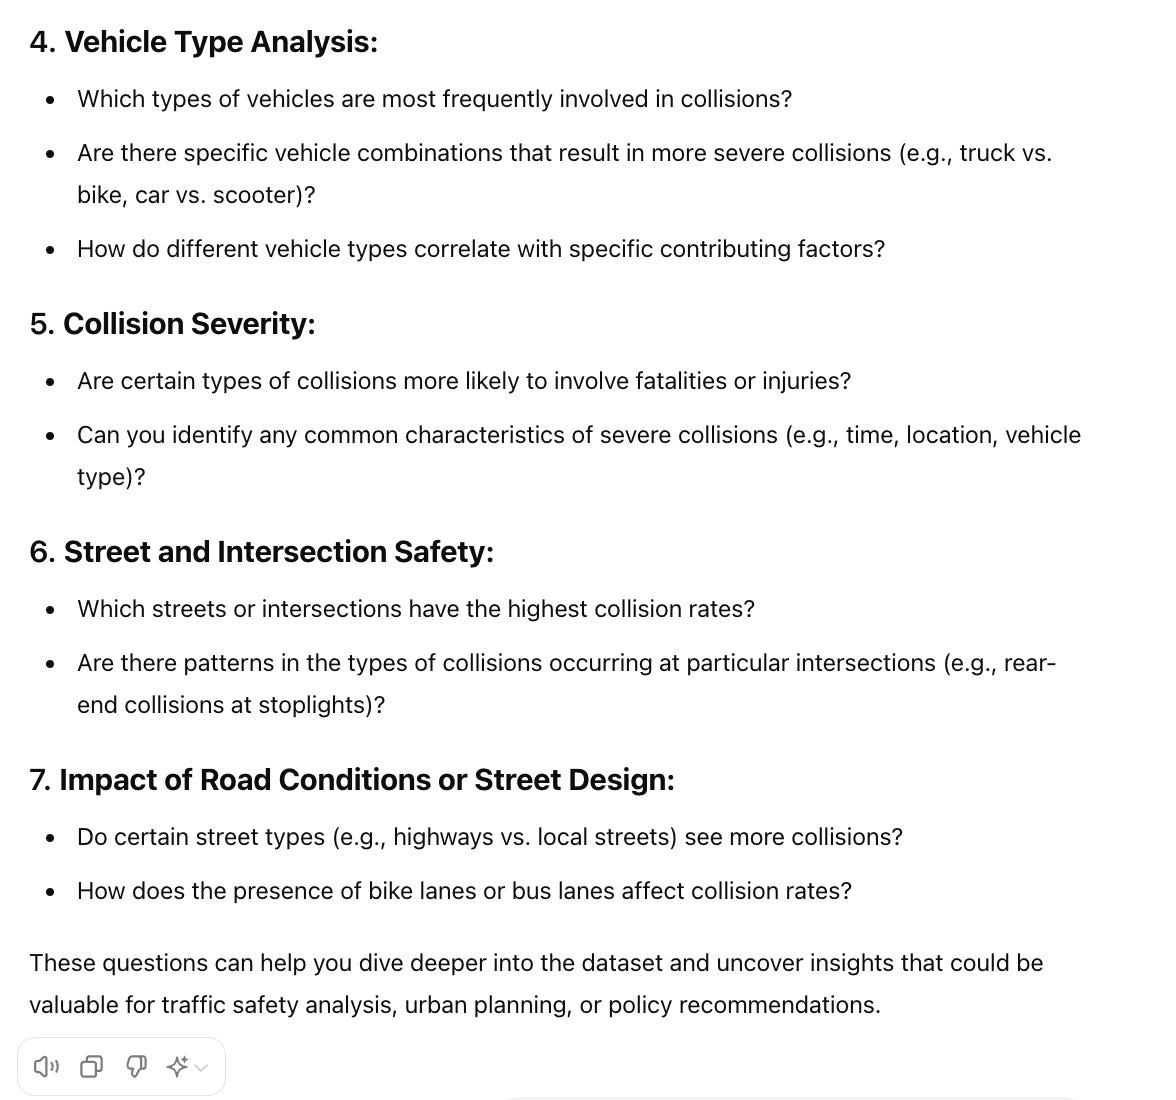
So … armed with my knowledge, I set out to check whether I could ask ChatGPT to suggest questions to investigate with the NYC vehicle collisions data set. I loaded the data set to ChatGPT, and I asked, “Suggest some interesting questions I should ask using this data set,” this is what I received as a response.
and
What do you think? I personally think this is very remarkable. There are a few things to notice. First, the set of questions is very comprehensive. They explore many facets of the data set. Second, the questions are very well formulated. They are not ambiguous, and they make sense.
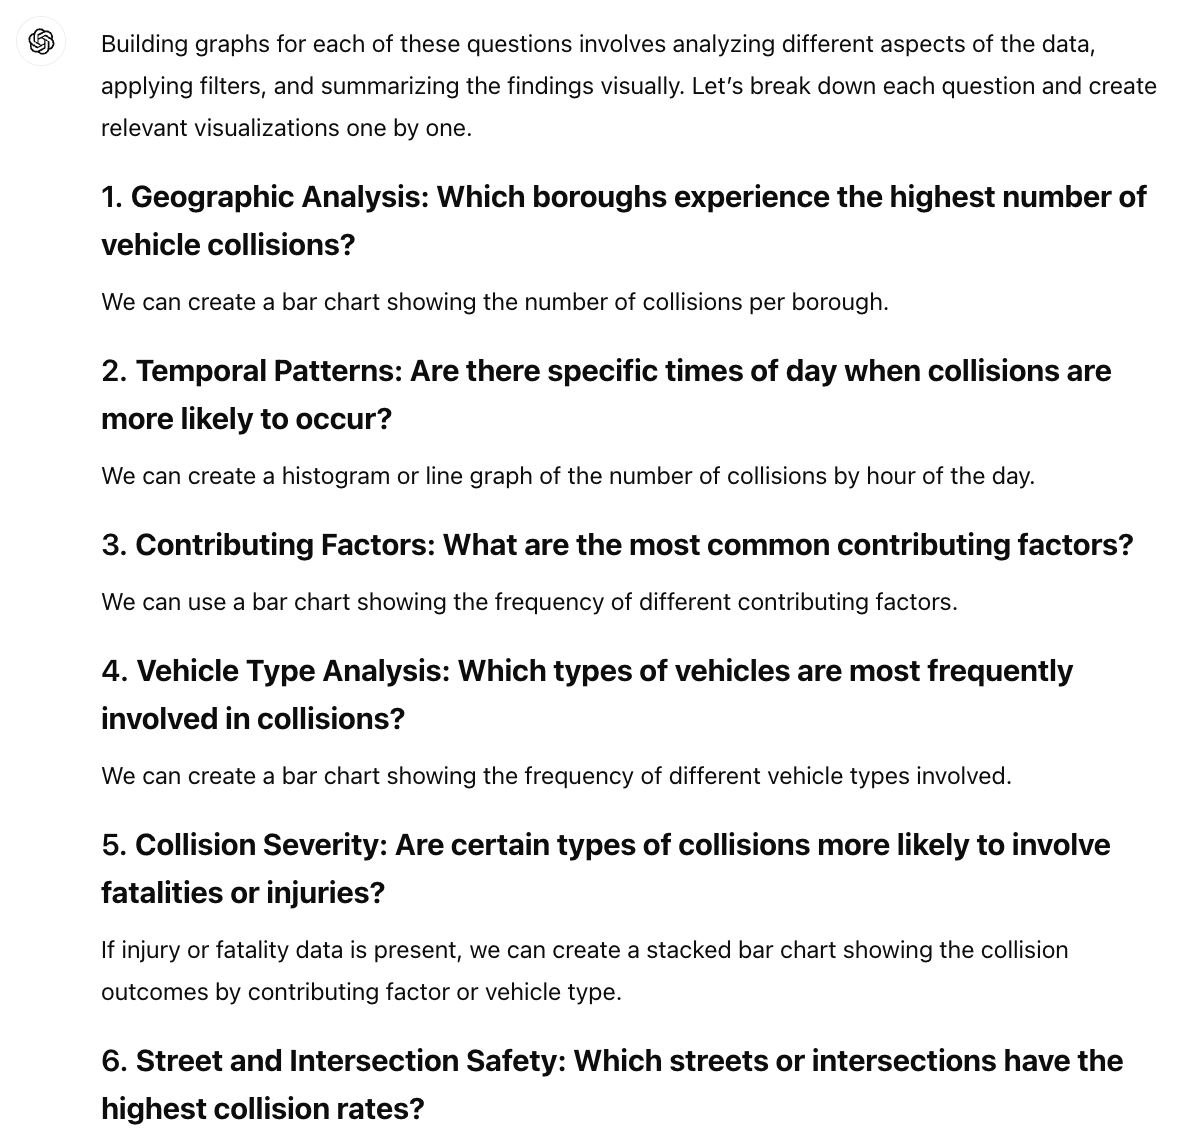
After receiving this response, a very natural next step for me was to ask if it could answer these questions with a few graphs, and this is a section of the response I received.
For a moment, I thought it did not even try to build actual graphs, but after scrolling, I found a few graphs. Looking at these graphs, I realized that some of the graphs might lead to misinterpretation due to the base rate bias problem, so I asked which graphs were affected by this problem and how I could fix it, and I received a perfect response.
This little experiment made me realize once again that there are amazing opportunities if we are only creative enough to imagine how these tools can be used. Also, these tools do not need to give perfect answers; they only need to steer us in the right direction. This experiment made me realize how this specific capability could be used for (1) teaching students how to formulate questions and (2) building data exploration systems that start with an overview. Effectively, it seems straightforward to load a data set, let the LLM decide the interesting questions, and produce an overview through a collection of charts. What would the effect of providing people with such capabilities be? I don’t know, but it’s certainly an interesting direction to explore!
And you? What do you think? Have you tried anything similar? Please let me know in the comments below.


great post and I share a lot of your thoughts on this. I think regarding the current deficiencies of LLMs, I am reminded a phrase from Sam Altman at the World Economic Forum earlier this year that haunts me still "these are the dumbest the models will ever be".
"What would the effect of providing people with such capabilities be? I don’t know, but it’s certainly an interesting direction to explore!"
One reason I am not a fan of frontier LLM models is that don't really support human-AI collaboration but promote straight displacement of work. In this case, I think student will use LLMs to just do all the work for them, similar to how high school kids used GPT3 when it was first released. Hopefully I am wrong and this technology forces us to try to evolve our critical thinking skills to be more innovative than what LLMs can produce.
In terms of the data viz process I think GPT is around the 50% percentile mark in terms of performance compared to the average knowledge worker. I am expecting GPT5 to be in the 80-90th percentile based on the scaling laws of AI.
Based on your experience with GPT with respect to data viz, where which level do you think the latest GPT model falls under? https://arxiv.org/pdf/2311.02462
Level 1: Emerging, equal or somewhat better than an unskilled human
Level 2: Component, at least 50th percentile of skilled adults , ex. Watson, LLMs, writing/simple coding
Level 3: Expert, at least 90th percentile of skilled adults, ex. grammarly, Dall-e
Level 4: Virtuoso, atleast 99th percentile of skilled adults, DeepBlue (chess)
Level 5: Superhuman, outperforms 100% of humans, ex. AlphaFold, AlphaZero, AlphaGo