
Using Data Visualization To Understand How LLMs “Think”
Reflections after attending a colleague's talk and examples of how visualization can help understand LLMs

(I know, I know … I am not supposed to anthropomorphize AI, but you must admit the title is quite catchy this way! For partial absolution, at least I put “think” in quotes!)
I attended a seminar by my colleague, David Bau, the other day, that got me thinking. David and his group work in an area of machine learning some call “mechanistic interpretability.” In this area, researchers examine models like those behind popular AI chatbots to understand how they work.
You may ask, “Why do we need to do that? If somebody built it, they must also know how they work, no?” The answer to this question is no. The reason why we don’t know how they work is twofold. First, models are trained on massive amounts of data, so the behavior they display is not “engineered” but learned from the data they are fed. Second, and probably more mind-blowing, the behavior we experience is an emergent property of a relatively simple prediction task, which is about predicting the next word in a sentence (the prompt you write when you write something in your favorite LLM). Let me repeat this last concept. All the amazing answers you receive from AI chatbots result from systems trained to do one thing: predict the next word. These systems have not been engineered by someone expecting these models to behave so coherently and to perform these amazing features. It was in all regards a “discovery.”
Why does this whole premise matter? It does because my colleague David, as well as many other brilliant scientists, study how these AI models work. In a way, and this is what I find most fascinating, humans have invented machines that we now need to study the same way we’ve been studying natural phenomena. The parallel with biology, or even more with neuroscience, is staggering. When we don’t know how something works, we start observing, prodding, hypothesizing, and looking closely until we can explain it and predict how it will behave. And this is what a small group of scientists like David is doing with AI models: they put them metaphorically “under the microscope” to derive and test hypotheses about how they work. This entire area of research is called “mechanistic interpretability,” and it’s a small niche full of dedicated people. If you want to get a taste of what this research looks like, take a look at the work done at Anthropic and Google PAIR, where researchers have been studying ML models for years.
An example: The Logit Lens
David presented a tool they developed called Logit Lens. You can see an example of the main data visualization the tool uses. This tool’s goal is to understand how information is processed within a transformer model, the backbone of modern language-based generative AI. Without going too much into the details, these models work as follows: given a piece of text, they predict the next word, then they use the new sentence containing the new word as an input to create another word until a stopping condition is met. This is what happens when you use your favorite AI tools.
The visualization below shows how this information is processed internally by the network.
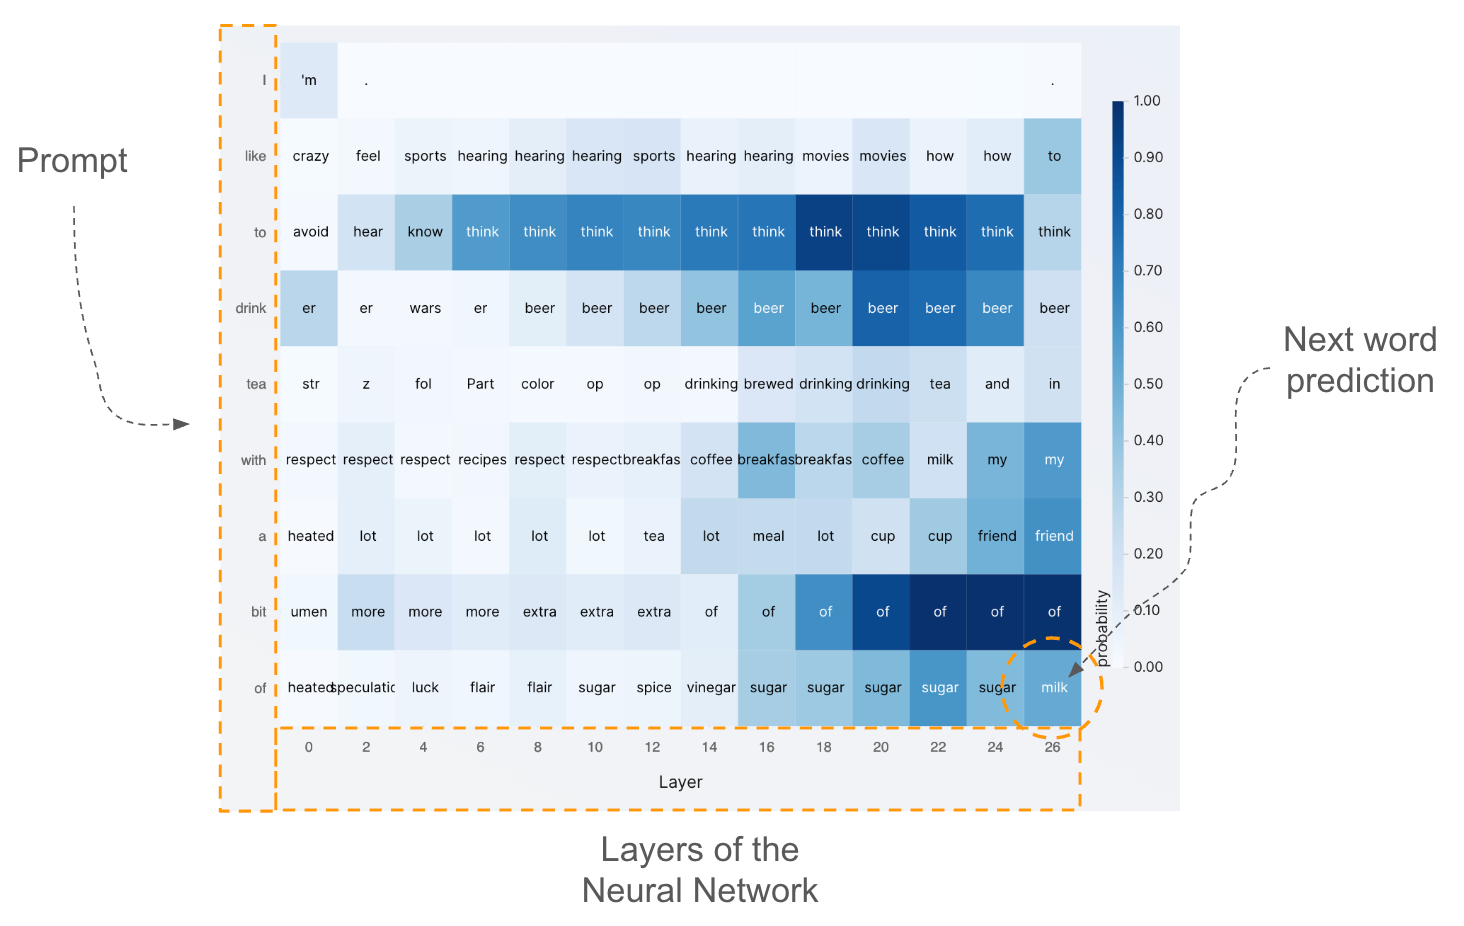
The rows represent the tokens fed into the model. This is the equivalent of the prompt you write when you ask something to tools like ChatGPT (in many models, words are further split into smaller parts rather than whole words, as in the figure). The columns represent the layers of data processing steps that exist internally in a transformer model. In these layers, information is processed to capture increasingly abstract concepts. The words you see inside each cell are a representation of the main concept taking place within the network at the corresponding level. If you wish, you can interpret each word as what the network predicts as the most probable next token in that specific location of the network. The last row is very important because it represents what the model would predict if the computation were stopped there, at that layer. The bottom-right cell is even more important because it contains the actual prediction of the last word.
Let’s analyze the figure above a bit more closely. I typed “I like to drink tea with a bit of,” and the next word prediction (check the bottom-right cell) is “milk,” which makes a lot of sense. If you look at what the network predicts in the previous layers (see the last row), you’ll see it’s “sugar” until almost the end, then it switches to “milk.” If you look at the last column, you can also see what the model predicts as the next token at the previous step, as if I had not provided the full prompt. Check two rows to the last, which corresponds to writing the prompt “I like to drink tea with a,” and you’ll see that the model prediction is “friend,” which is quite plausible.
I hope this gives you a glimpse of how tools like the Logit Lens can help us understand how these models predict and reason about the input we provide.
If you want to learn more about how the Logit Lens idea works, I strongly suggest reading this essay on Less Wrong, which provides a more detailed explanation of the technique and several examples of insights one can derive from it.
What’s the role of visualization here?
After showing the examples above, I think it’s not too hard to imagine that data visualization could play a role here. Neural networks are complex objects that process a staggering amount of data. When you have plenty of data, vague goals, and the need to generate new hypotheses and intuitions, visualization is the most powerful tool in the data toolbox.
Visualization researchers have developed many techniques over the years to understand other types of neural networks, and new methods are being developed every day. However, my cursory look at the visualization academic community suggests that there is still too little focus on the problems of mechanistic interpretability. The most exciting work seems to come from industry labs rather than academia. Maybe a reflection of the fact that we don’t have easy access to production models and compute.
However, I am convinced that visualization can play a big role in this space. I have been interacting with my colleagues over the last few weeks and have been able to provide useful advice on visualization design. Visualization experts can help at least with three bottlenecks I see.
Scalability. The amount of data AI models must handle is enormous. Making visual representations scalable is an old problem with many potential angles of attack. Visualization experts can suggest ways to navigate and summarize large quantities of data in meaningful ways.
Abstraction. Visualization is not only about mapping data to graphical representations but also about designing useful abstractions and metaphors. Visualizing data processing in neural networks requires developing such abstractions, and visualization researchers are accustomed to inventing them.
Interactivity. When data is complex, large, multidimensional, and multimodal, there’s no single representation that can help answer all the questions. Interactivity is crucial in these cases because it helps define clear goals and adapt visual representations accordingly. Again, this is what visualization researchers have studied for almost 50 years and are well-equipped to suggest and invent clever interactive solutions to investigate complex neural networks.
While visualization researchers have developed many solutions for visualizing neural networks, there is still relatively little awareness of “mechanistic interpretability” and the fantastic opportunities that exist when focusing on supporting researchers who study how generative AI models work.
I hope to see more people involved in this area. I am myself moving first steps in this direction, and I hope I’ll be able to write about my progress here. Let me know what you think!