
Using Data Visualization to Instill Doubt
Can we use data visualization to generate more rather than less uncertainty?

It’s incredible how the status quo can sometimes limit our way of looking at problems: hidden layers of assumptions we don’t even notice because we have never been exposed to a different way of looking at a given problem.
A good example of this is how we implicitly use data visualization as a tool to demonstrate how things are. Visualization is about looking at data to provide answers to questions. To reduce our uncertainty about a given reality of interest. We want hard evidence! The stronger the evidence, the stronger the message. Take scientific publishing as an example. What’s the use of visualization in a scientific paper or report? To provide evidence regarding a scientific hypothesis. How about data journalism? To delineate the facts regarding a story. Often with the intent to persuade people that things are a certain way. And how about business presentations? To show what is the current situation and what needs to be done. But what if what we want to communicate is the fact that we don’t know? That we don’t have an answer to a given question. Or even more precisely, what if what we want to communicate is that we know “less” than what we think we know?
Think about it for a moment: when was the last time you saw a visualization or data analysis that aimed at creating more rather than less uncertainty? It’s pretty rare.
Only two projects come to mind when I think about this idea. The first is an old Bloomberg interactive piece on climate. The interactive article was organized around a series of questions regarding which factors could be the basis for the warming temperature we have experienced during the last 100+ years. Each chart has a specific question and a chart that shows no correlation between the factor and the temperature. Here is an example of the influence of the sun:
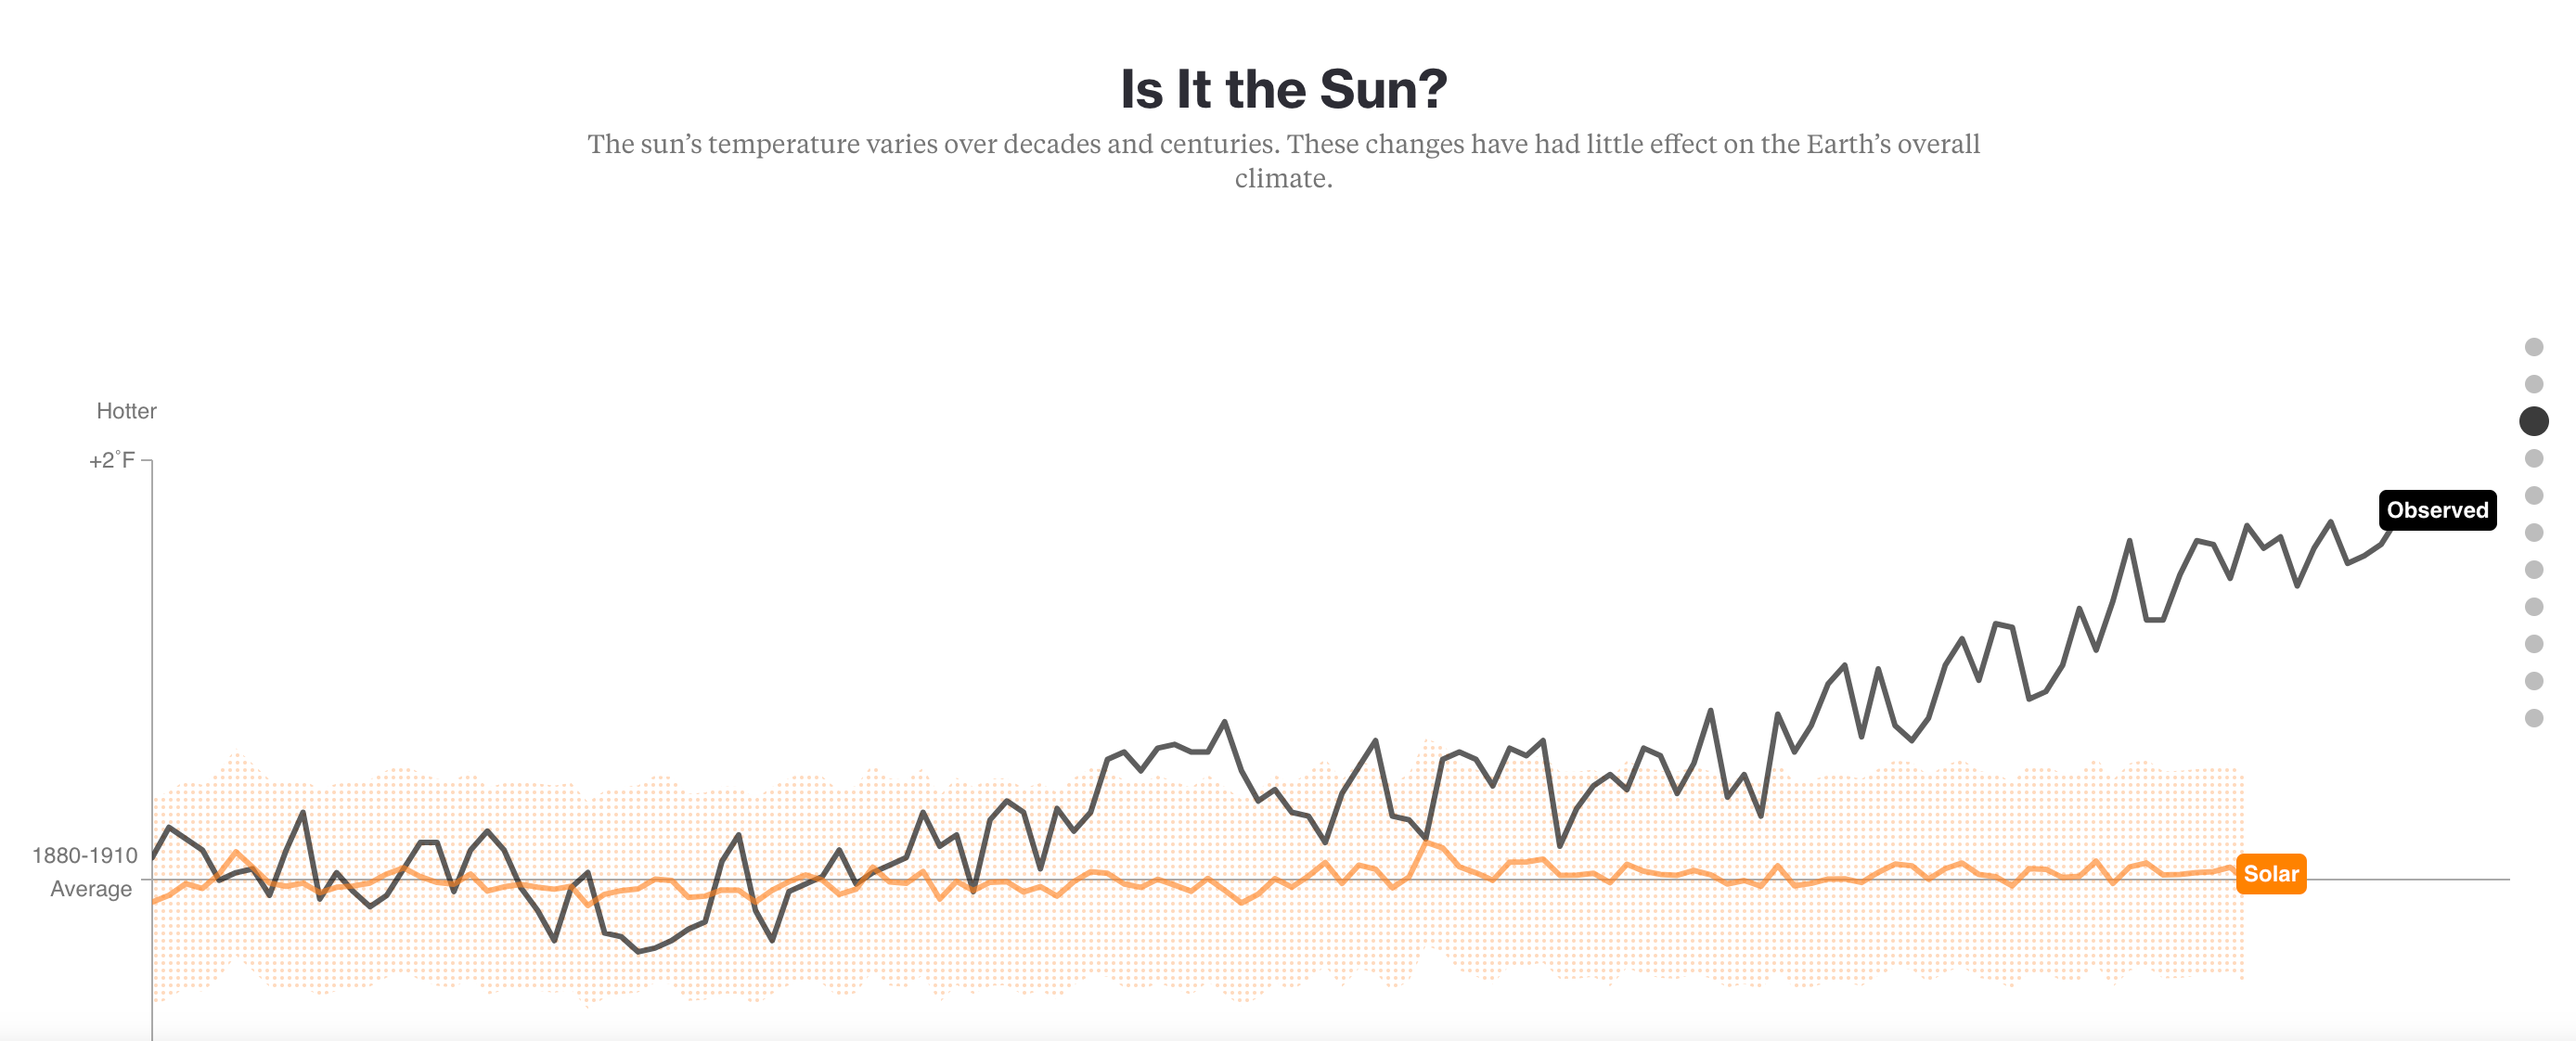
Unfortunately, the article is not exactly the type of visualization project I am looking for because all these questions and charts are in preparation for a “big reveal” at the end, but I think you get the idea.
(As a side note, In 2015, I interviewed the authors of this piece on the Data Stories podcast. You can still listen to it by going to the episode web page. I recall it as a super hilarious time. I visited Bloomberg, turned on the mic, and we started talking. I also took some pictures at the end and had a great time.)
The second example is a long-form article from “Slime Mold Time Mold” called “A Chemical Hunger – Part I: Mysteries,” investigating the mystery of what caused the obesity epidemic. This one, even more than that Bloomberg piece, is all about things that we expect or believe could be the cause of something, where the data does not seem to support the hypothesis. Here is an example from the second episode of the series that shows the relationship between sugar intake and obesity in the US.

How reliable is the information presented in these articles? I don’t know. This is beyond the point I am making here. My argument here is that data and data visualization are very rarely used this way. Why?
My knee-jerk reaction is that the main reason is because everyone has an “axe to grind.” We love to use data to convince people that we are right. Let’s face it. This is mostly what we do with data. I don’t like it, but I do it myself all the time. Heck! What are those graphs I put in my papers there for?!
If you think about it, however, it’s a missed opportunity. First, data stories that instill uncertainty can potentially be very entertaining because they work like mysteries. Everybody likes mysteries! In fact, the second project I mentioned above has the word “Mysteries” in the title. Wouldn’t it be more interesting to have data visualization projects about mysteries? It’s a genre that could have quite some success, in my opinion.
The second, and maybe more serious, is that we all seem to operate under this default assumption that the role of data is to demonstrate that things are in a certain way. That our goal is to reduce uncertainty in the world. But as explained above this is not the only way. In fact, the whole scientific enterprise is about trying things out and killing mental models of how we think something works by using evidence. The best way to proceed in science is to (1) create mental models about how something works, (2) deduct from these models what kind of observations should stem from the theory if the theory is correct, and (3) refine the theory when we find that our results don’t match with what is expected. Results that don’t match our expectations are important! They carry very useful information and are crucial for our understanding of the world.
Even in journalism, where data is often used too casually to push a preconceived idea to readers, this strategy could highlight our beliefs' inadequacy. They can be a vehicle for instilling doubt more than certainty.
To be clear, with this I am not claiming that providing evidence to support certain arguments or hypotheses is not important or should be discarded. What I am advocating for is a broader palette of arguments, where one argument I’d like to see more often is that we simply don’t know yet and that our beliefs about something should be weaker rather than stronger. That’s it.
And you? What do you think? Do you know of other data visualization examples that instill more doubt? If yes please share in a comment below. Thanks!
Would the 'draw your own line' viz be an example of a viz instilling doubt? For most viewers the line you draw is nothing like what the actual data shows so you realise how little you know.
Another example could be the hurricane path projection possible paths?
What do you think is the difference between using data and using other objective characteristics of things like color or shape? Data are just things that have a measured size. A graph is just a translation of words about these things into a shorter and faster language through pictures that make it possible. Anything can be used to prove or create doubt, to convince, to entertain, etc.
You can also write about the fact that the earth is flat in words and add a picture to demonstrate it. :)
There is nothing in data and data visualization in this respect that is different from any other means of communication. It is a text about things that we decide what to write in this text.