

As I promised last week, I started producing new lectures for my Information Visualization course. As I produce new ones, I will create a short post here to notify everyone that a new lecture has been published. I also created a specific section in the newsletter (find it in the top bar of the home page) to jump directly to the video lectures. You can also sign up for my YouTube channel and find the playlist that collects the lectures.
Here is a quick preview/outline of what is covered.
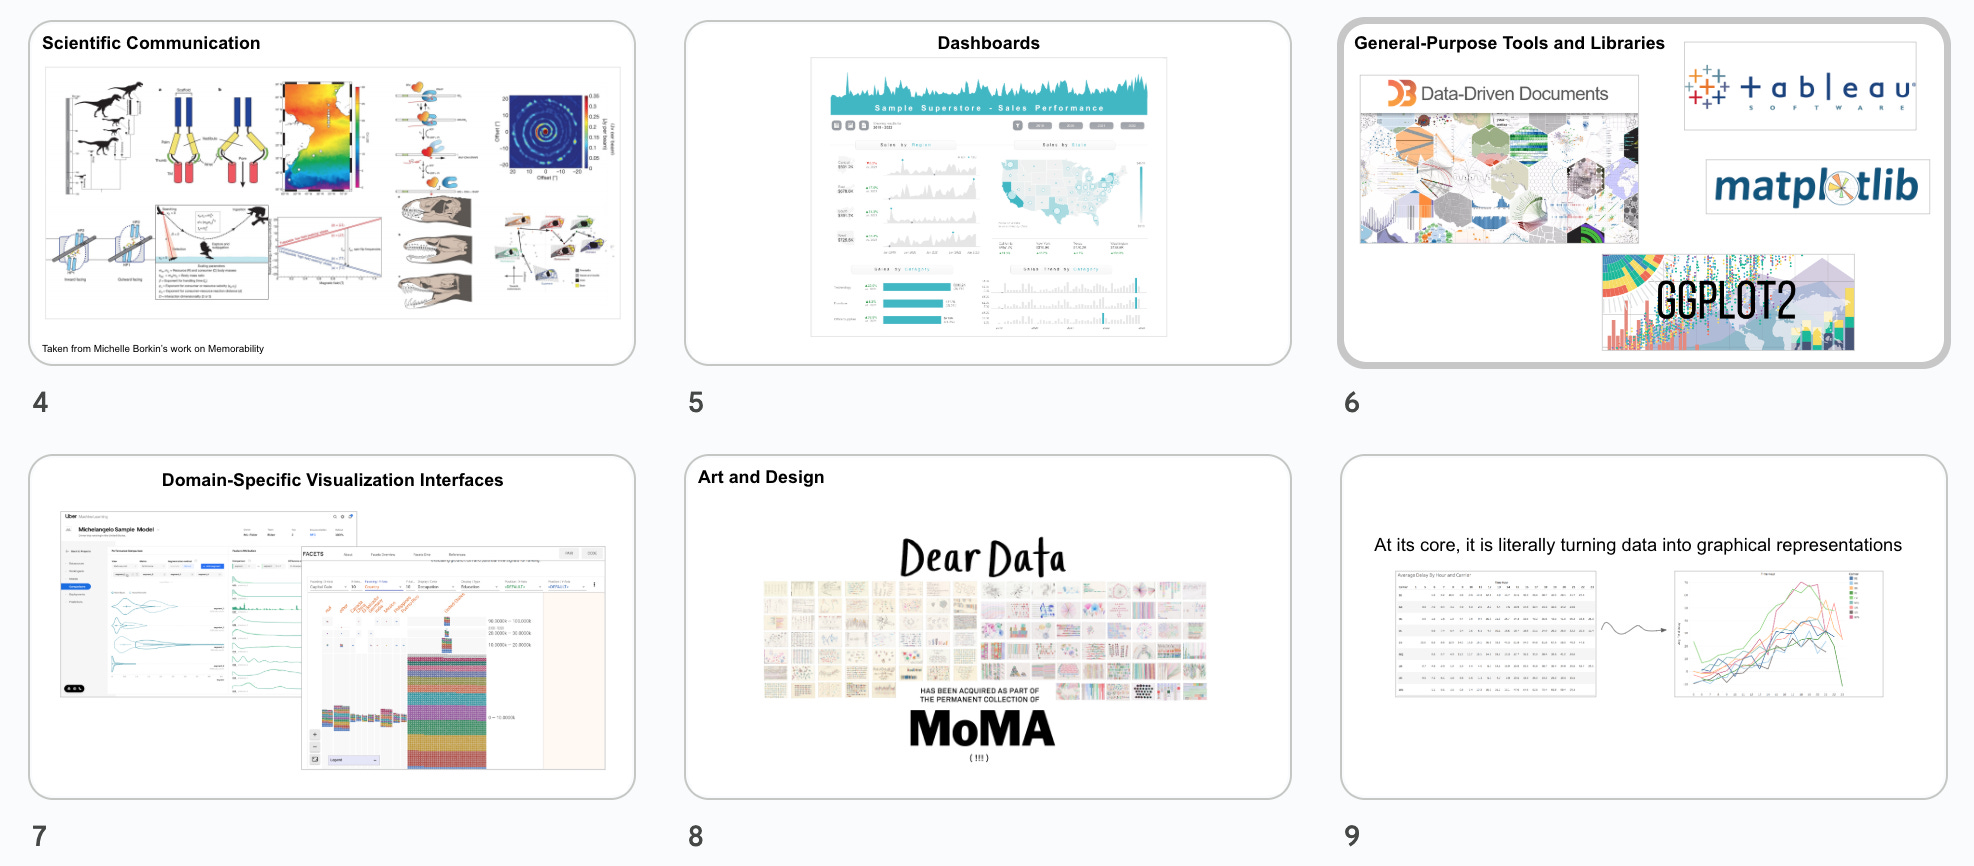
Examples of the many things we call “Visualization.” Many!
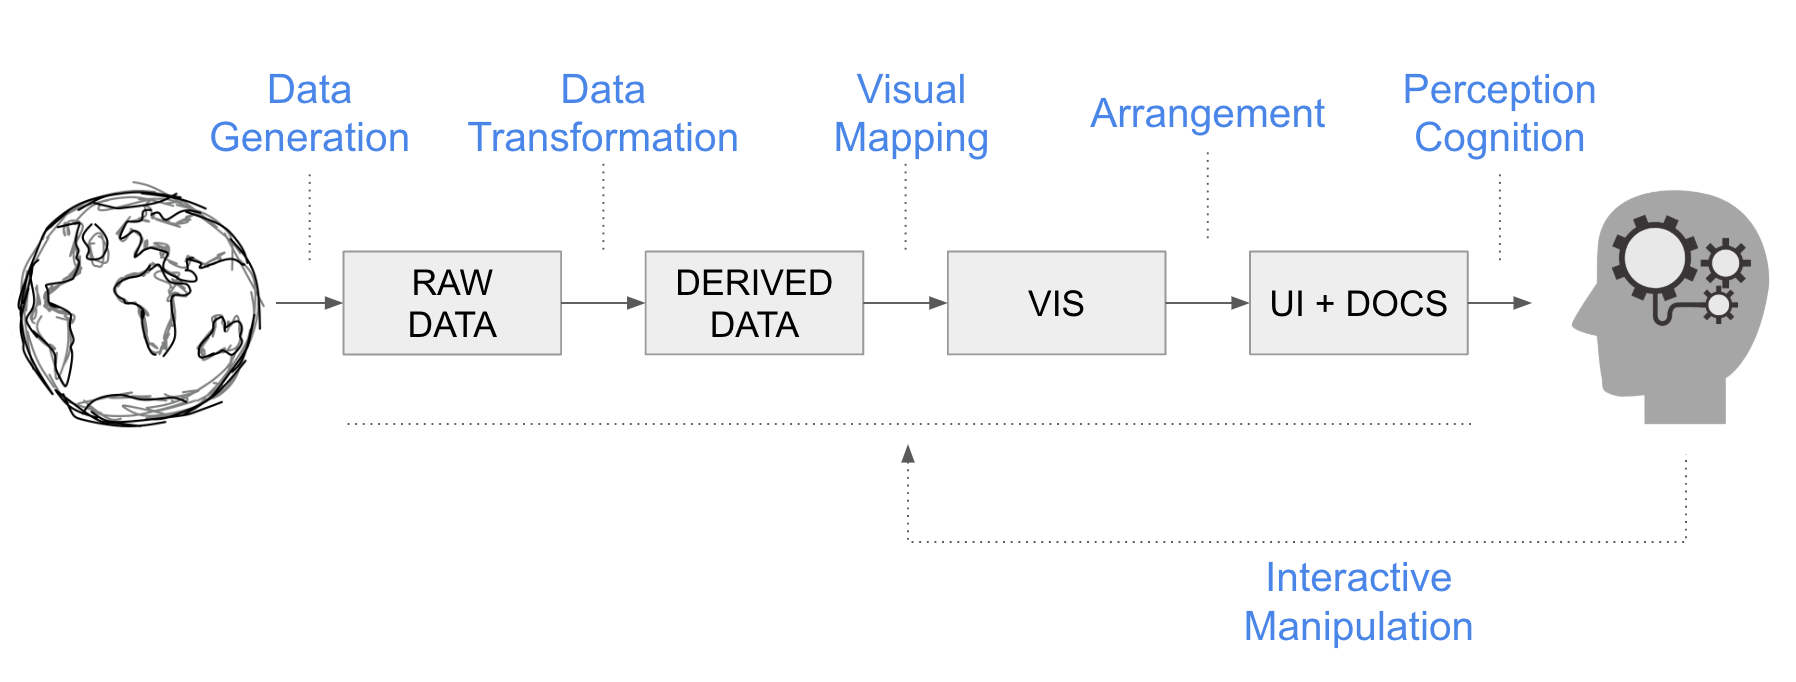
Reference model to talk about what visualization is about
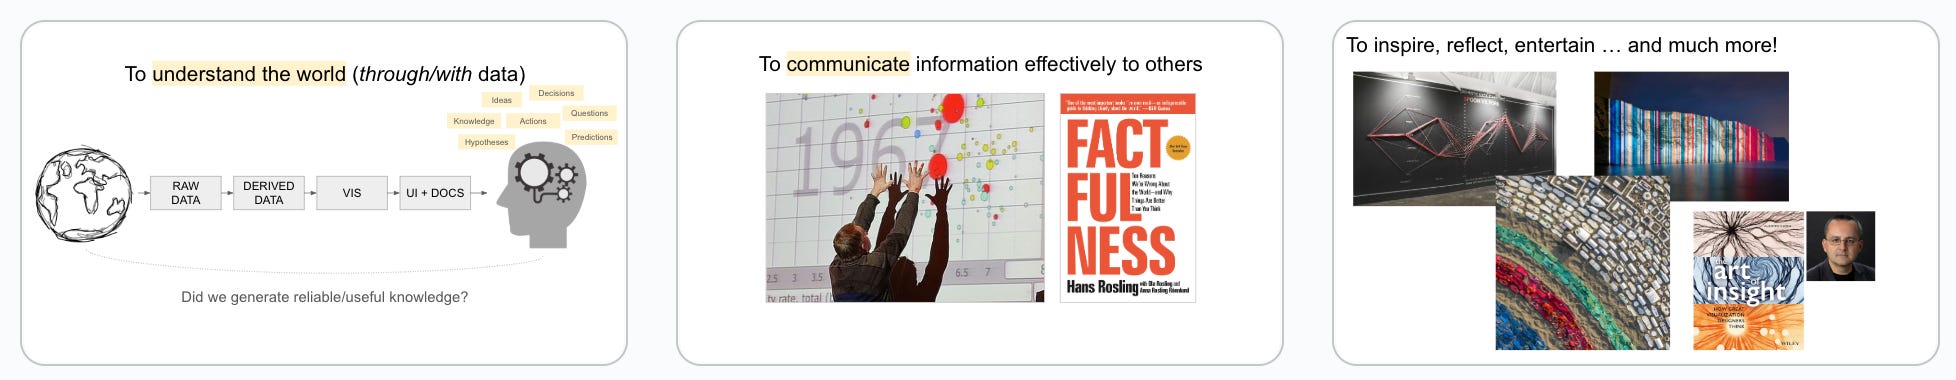
Data visualization goals
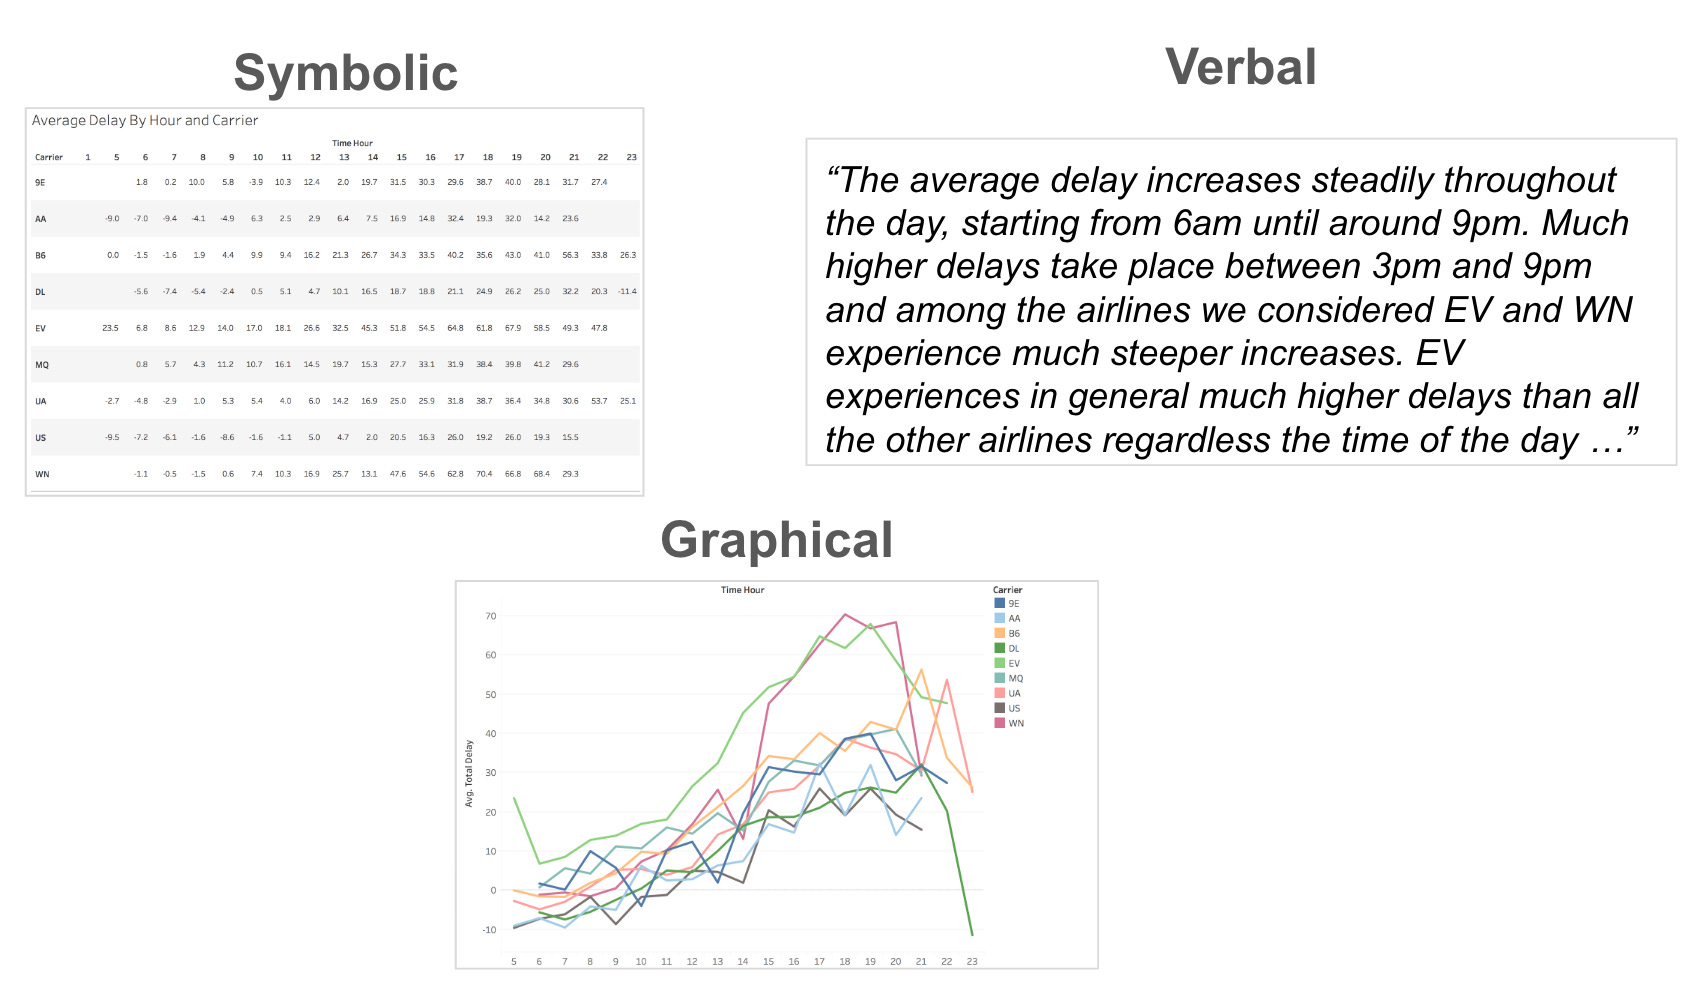
Three modes of communication
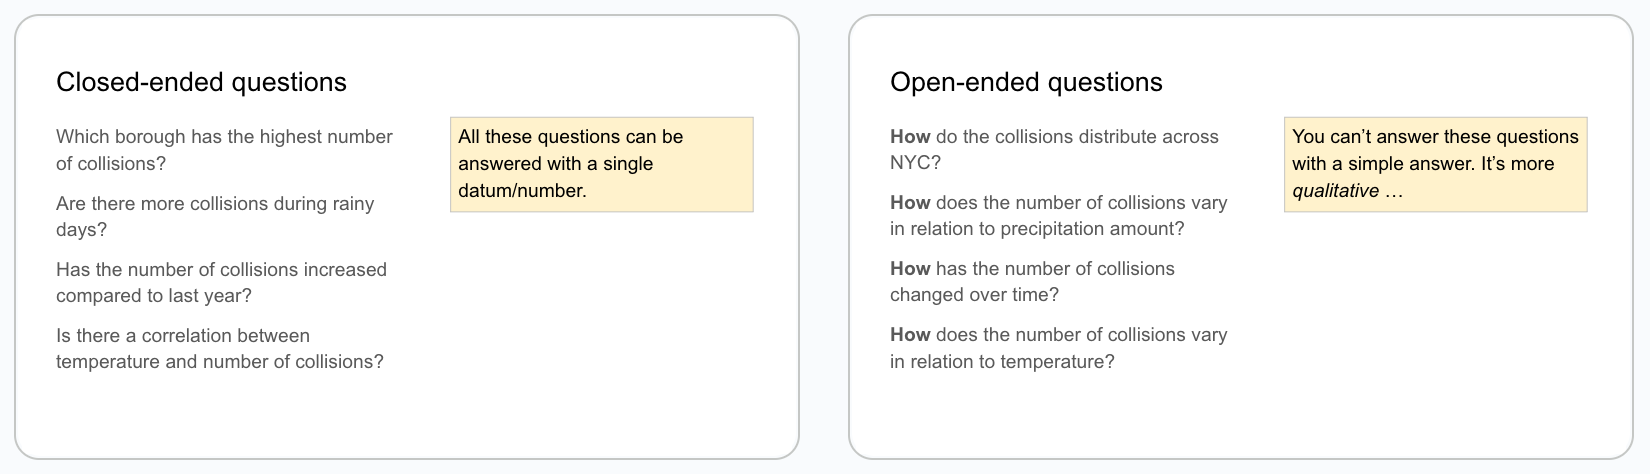
Open-Ended Vs. Closed-Ended Questions
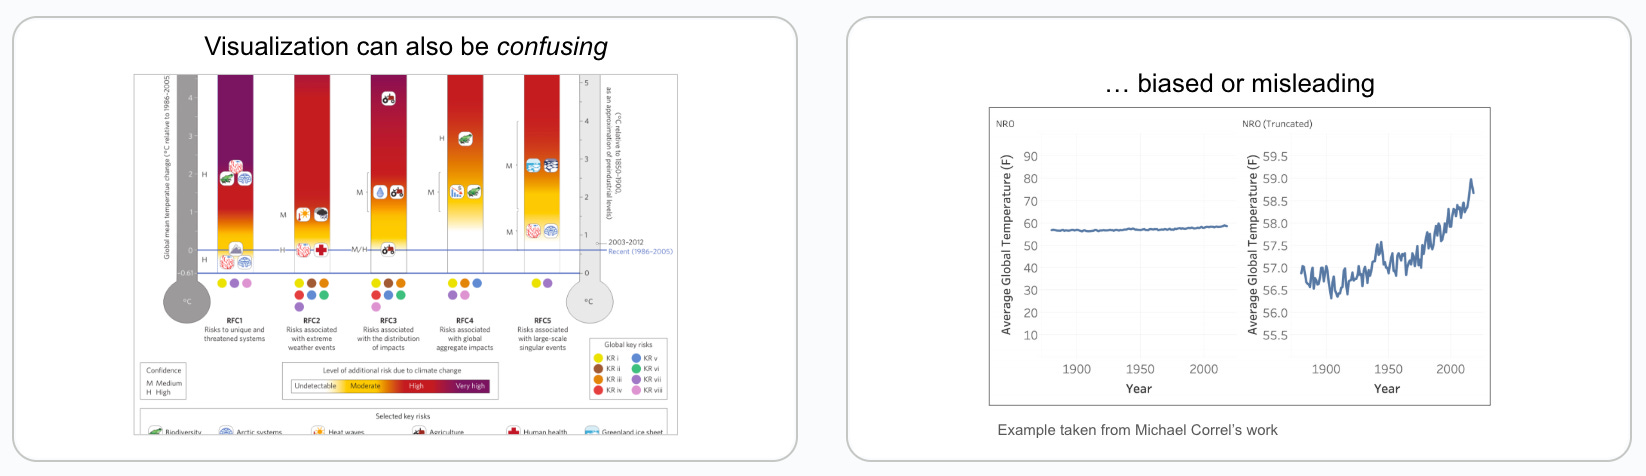
Visualization is not always desirable or effective
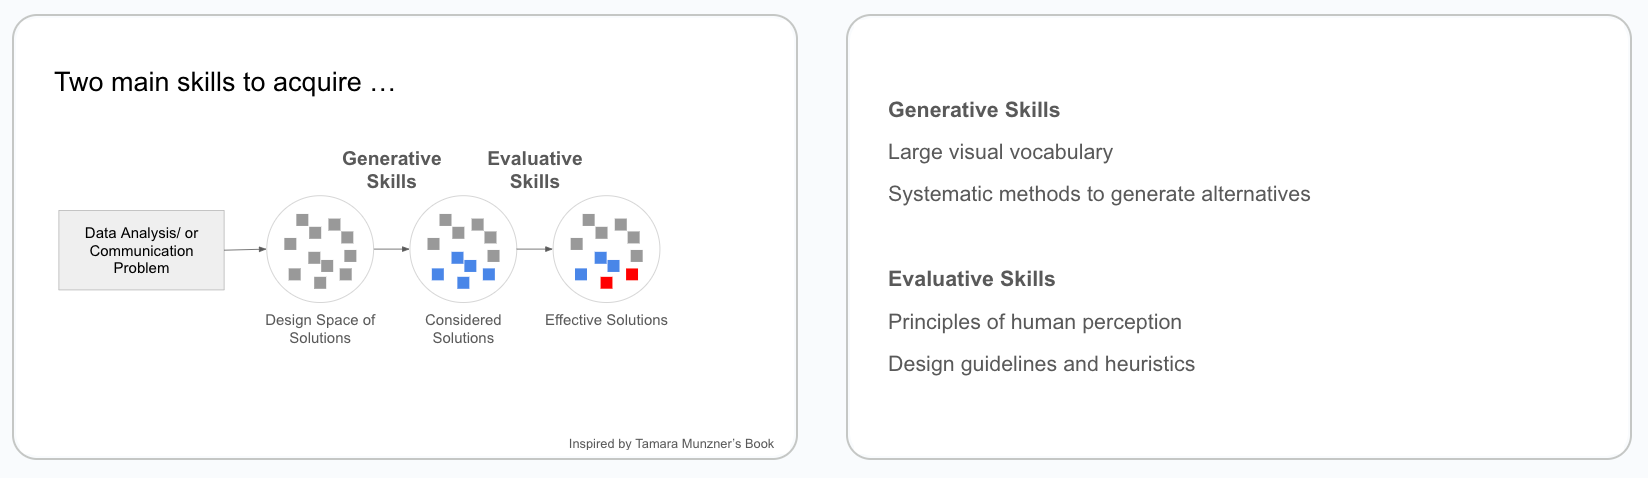
The fundamental skills you need in visualization
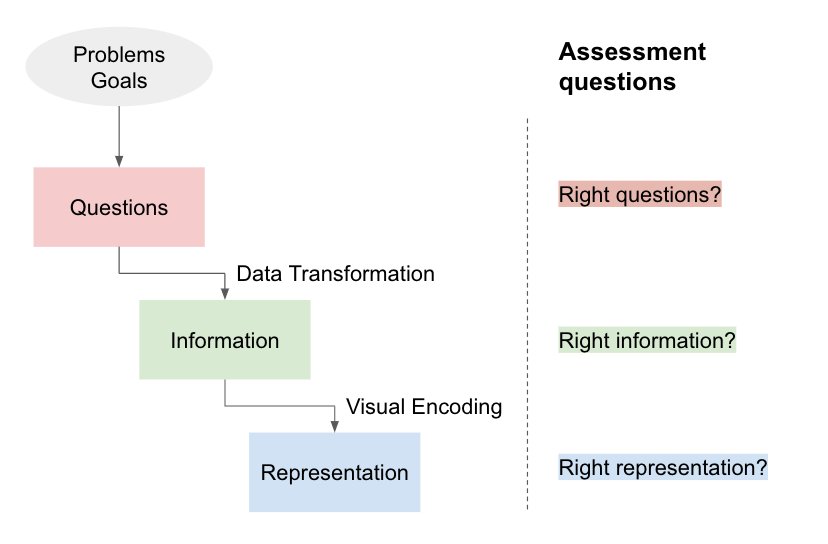
A (simplified) process model for visualization design
That’s all for now. Let me know what you think!!!!
Really Nice! Thanks for sharing it's inspirational .
However, I am not certain I agree with your pipeline :)
For instance you can use data viz as a raw data collection
( https://dl.acm.org/doi/10.1145/3613904.3642808 ) or even autographic vis ( https://offenhuber.net/project/autographic-visualization/ )
Jansen & Dragicevic pipeline seems to have more details
(https://ieeexplore.ieee.org/document/6634126/), while it may be to advance for an introduction, this one is more common than the usual use of Infovis in CS
btw can I borrow the pipeline figure for something I will credit you?
best
Samuel
Where can I find the actual course?