
Beyond Precision: Expressiveness in Visualization
Using precision as guidance for visualization design is powerful and yet limited in many different ways. Expressiveness may help.

In recent years, I have grown increasingly dissatisfied with the way we teach and talk about data visualization – at least from what I observe in academic settings. In particular, I am concerned with the predominant paradigm that visualization can and should be designed according to how precisely a given visual encoding can represent data. The story we tell ourselves (and the same story I tell with increasing discomfort to my students) goes a little like this:
Visualization is about mapping data values to visual channels;
Some channels are better than others at communicating data values;
Hence, to build effective visualizations you should choose the best channels for the available data values.
Except, it does not work very well. While precision is a useful factor to keep in mind, it’s neither sufficient nor necessary to create effective visualizations.
Let me explain in more detail. Drawing first from the work of Jacques Bertin, and then Cleveland and McGill, visualization pedagogy converged on the idea that there is a ranking of visual channels that can guide us in making design choices. This is the ranking as shown by Tamara Munzner in her classic visualization textbook (my favorite textbook, and the one I use in my courses):

Following current guidelines, we would try to visualize quantitative values using the “position” channel as much as possible. Then we would go down the list of channels in order of importance, trying to match the most important information with the most effective channels. However, there are (at least) two problems with this guideline. First, it’s not always true that visualizations that use position are “better” than those that do not. Second, position can be expressed in multiple ways, so the guidelines leave us unable to discern between visualizations that use position differently.
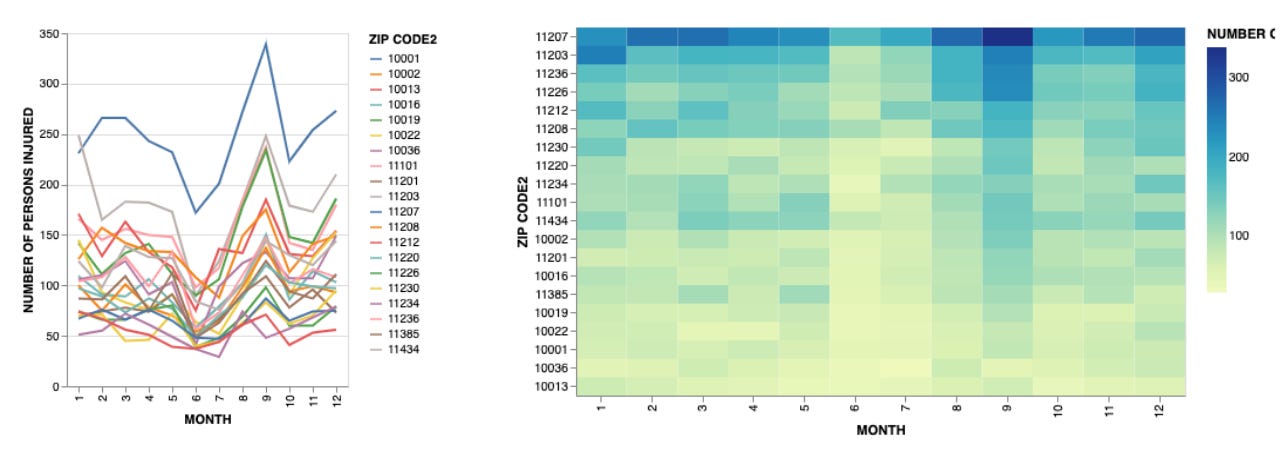
A good example of the first problem can be seen in heat-maps like the one below. The heat-map uses color intensity to communicate quantities, whereas the line chart next to it uses position (the vertical position of the start and end points of each line). Why would one ever use a heat-map if line charts are available?
As for the second case, there are a few examples. The first one is my favorite because it is what originally made me think more deeply about this problem. The example below is a reconstruction of a problem I faced in class a few times when assigning an exercise to visualize the vehicle collision dataset from New York City. The exercise asked students to compare the boroughs according to how many people were injured and people were killed in vehicle accidents. Students came up with several solutions, including the two below.

I did not anticipate seeing a scatter plot as a solution because the goal was not to see if there is a relationship between the two measures, but instead to rank the boroughs according to the values of these measures. But when I explained my reasoning, the students who created the scatter plots protested, “But you said position is the best channel!”. And admittedly I could not point to any element in my course that would justify my recommendation. That is when I realized there was a gap.
Here is another example created by Steven Franconeri when we wrote, together with Michael Correll, our position paper “Why Shouldn't All Charts Be Scatter Plots? Beyond Precision-Driven Visualizations”.

How do I decide which representation among these four works best? They all use position! Does this mean that these four representations are completely equivalent? Hardly.
And how about this last one taken from a post of Alberto Cairo in which he re-designed (on the right) a chart from the Georgia Department of Public Health (on the left)?

If I order the bars one way, I perceive a completely different set of patterns than the other way around. How do I decide which one works best? The ranking of visual variables does not help with this and other types of decisions.
Enter Expressiveness
The problem with guidelines based on precision is that visualization is not really about precision. Sure, there are cases where precision matters because it allows readers to detect important differences that would otherwise be missed. But visualization is less about precision, and much more about what the visual representation expresses.
There are many ways to define expressiveness (some better than others) but the basic idea is the following: data contains information that we want to communicate, and that information is what we want to “express” with visual representations. Visual representations are made of visual properties that “express” certain types of information. Good visualizations stem from a good matching between what we want to express and what the visual representation expresses (something highlighted in the foundational work of Jock Mackinlay, who I believe introduced the term in the first place).
Expressiveness is much more about finding a good match between visual properties and “concepts” than precision or accuracy.
But, let me show you a couple of examples to make the concept a bit more concrete. Color is a great example of the role of expressiveness. When we use a diverging color scale like the one on the right, we implicitly express the idea that there is a zero or middle value, and that the values are segmented into two categories: one above and one below the threshold. When we use a color scale like the one on the left, we do not communicate that type of segmentation.

Deciding whether to use a diverging or non-diverging color scale is not a matter of precision or accuracy (in fact a diverging color scale may even be less precise!), it’s a matter of good semantic matching; a matter of expressiveness.
Let me use a more controversial example: bar vs. pie charts (yes, the dreaded pies 😱). In visualization orthodoxy, pie charts are absolute evil and should be avoided at all costs. But when I show a pie chart, I implicitly suggest to the reader that what counts in the visualization is the size of each part with respect to the whole (that is, a part-to-whole relationship), not the absolute values. Now, the same idea can be conveyed with a single stacked bar; which is in fact my preferred solution. But the point is: an area subdivided into sub-areas conveys something important that goes beyond precision: it expresses a relationship that is important for the type of message I want to communicate.
One recent source that describes some of these concepts is Tamara Munzner’s book mentioned above. The book divides visual channels into two large groups, magnitude channels and identity channels, according to whether they are more appropriate for quantitative or categorical information. For example, if I want to express a quantity, I shouldn’t use color hue, because humans do not perceive hues as ordered). And if I want to express categories, I shouldn’t use symbol size, because we naturally associate sizes with quantities, not categories.
So, this ideology goes in the right direction: we can choose channels according to what they express and what we want to express, but at the same time it is also extremely limited. How so?
There is more to express
More can be expressed
There is more to express
The first limitation is that there is more to express than whether a value is categorical, ordinal or quantitative.
Following the guidelines one typically finds in visualization books, it seems almost like the designer’s task is to find the “right representation for a given data type”, as if data type was the ground truth; the unmovable thing that needs to be represented correctly (Tamara Munzner’s book does emphasize an intermediary steps of “data abstraction”, which is meant to decouple data types and encoding). But a better mindset is one based on expressiveness: what is it that I want to express? Is it important to express that something is ordered? Or that the data objects are organized around a given set of categories? Or that a given phenomenon has a spatial nature?
Let’s look at other things one may want to express. Without any pretense to be exhaustive, here are some examples off the top of my head:
Directionality: can the values be positive or negative? Is there a zero value or a meaningful threshold?
Part-to-whole: do the data objects represent the part of a whole?
Order: are the objects organized in a meaningful order?
Grouping: are the objects organized around a set of meaningful groups
Space/time: do the objects represent space or time or space-time phenomena?
More can be expressed
The standard list of visual properties used in visualization may be too restrictive to describe some of the basic concepts outlined above.
One problem with the list of visual properties is that they are often “under-specified”. Take position as an example. Calling position “a” channel is kind of funny. First, because position is the most powerful visual property for the visual system and second because position can express relevant properties and concepts in many different ways. The classic characterization distinguishes between position on a common scale and unaligned scale (see the image in the table with the ranking of visual variables above), as if that was all that position can express. But position expresses information in so many other important ways! Think about position on a single axis versus an orthogonal pair of axes; position in polar coordinates; position on a map; position to express grouping and alignment; etc.
Not only that, but the concept of position changes quite dramatically according to what type of object or symbol is drawn. Positioning a single dot is quite different from positioning a bar, a line or a whole polygon. It’s way more nuanced than it seems.
One may argue that this is a useless distinction and that it only makes visualization guidelines way more complicated than they need to be; and I do think this is a legitimate criticism. But I also think it’s intellectually necessary to “go there” and see what we can make of it. Discarding a more nuanced characterization of visual encoding based on expressiveness seems premature. The visualization community needs to try and see how far we can go. Pursuing expressiveness may ultimately lead to inelegant or irrelevant findings, who knows. But it may also open the doors to a much richer description of how visualization works and to much better guidance.
Before concluding this section I want to mention an important aspect of expressiveness that is often overlooked. When we talk about expressiveness and its key role in designing data visualizations, we have to keep in mind that expressiveness is not only useful in figuring out how to express the information and ideas we want to communicate, but it is equally useful in making sure we do NOT accidentally convey information we did not intend to express. This is a common problem and it is surprising the visualization community does not have a more systematic way to talk about it.
What can we do?
It seems to me that one possibility is to try to make progress along the lines mentioned above. We can work towards having a better and more complete characterization of what information and concepts we typically want to communicate with data and, similarly, develop a better understanding of what visual properties exist and what they express.
One big issue is granularity. At what level of abstraction do we want to describe these things? The more granular we go, the harder it is to generalize. In addition to that, the impulse to be able to describe every possible situation may backfire by making things more complicated than they need be.
A second issue is how we should combine findings with design recommendations. Once we have a better description of data concepts and visual features, how do we build guidelines that can help people think more productively about visualization design?
Maybe a more conservative approach is to start from the existing characterization (it could be the one found in Tamara Munzner’s book) and try to expand it and perfect it. One could add more data characteristics and expand on existing channels.
Finally, if we want to approach this problem scientifically, we will also need to verify that guidelines and models based on expressiveness have a measurable impact on visualization effectiveness. For instance, it would be useful to explore if, among two competing visual representations, the one having a better match in terms of expressiveness leads to a difference in comprehension (which is not easy to measure, but that’s a different story).
Why does it matter?
It matters because we have some basic notions regarding what is a good visualization and how to create one.
The ranking of visual channels provides some guidance, but it also has a number of important limitations. Beyond that, there is only a very vague set of design guidelines. We, as readers, also have a really vague notion that some types of data fit some types of charts; which is an incredibly blunt tool.
The idea that one could choose the right representation according to what type of data one has is extremely limited and may be irredeemably flawed. The idea that data speaks for itself has no connection with reality in my opinion. We do not visualize data, we visualize ideas based on data, and we need a better mental model (and maybe even a theory) to design visualizations.
P.s.
There is a substantial body of scientific work that goes in the direction I advocate for in this post. Since I want to become more familiar with this existing body of work, I am only going to mention it here to let the reader know I am aware of it and that I need more time to process it. I am aware of Barbara Tversky’s work in this area and I know there is a lot to learn from it (e.g., her “congruence principle” seems to fit very well with what I wrote). And I am also aware of “Cognitive Fit Theory”, a theory that describes the need to find a good fit between concepts and their representation.
Acknowledgements
Thanks to my PhD student Racquel Fygenson for copyediting this post (fixing my broken English) and providing a lot of useful comments. To Jane Adams for useful discussions after I presented this idea to our group. I also thank Michael Correll and Tamara Munzner for providing useful comments and criticism to a draft version of the post.
Excellent article Enrico - shared it with my class. I think the classical teaching method of precision of reading is a good guide, but we also need to take into account, as you say, effectiveness. The appropriate choice of encoding depends on not just the type of the data but also the semantics (great point about the part/whole argument in favour of pie charts). I also wonder what role convention has to play? If people expect some types of data to be presented using a given type of visualization, should we take that into account, even if it's not empirically ideal in a lab-based perception study? Maybe? Or maybe we should be pushing for adoption of new evidence-based designs.
I like this post, and I think you are unto something. What difficulty I find with your scientific approach to validating the effectiveness of expressiveness is that both measures are inherently subjective. You are going to be measuring the quality of the visualizations based on perceived understanding (effectiveness) to determine whether the graph type (expressiveness) has any impact. It looks to be more of Sociology issue in that framing.